What does it actually feel like to have money in Nigeria right now?
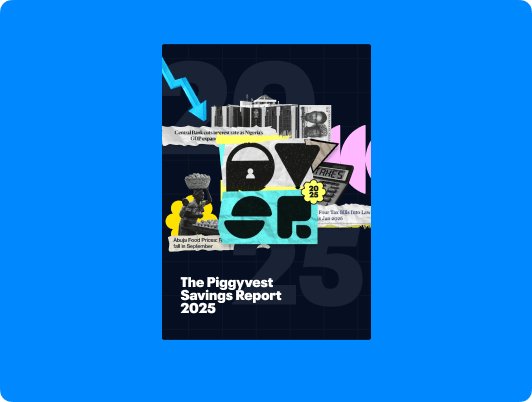
PiggyVest’s third Savings Report was its biggest yet: 26,000+ Nigerians, three years of financial data, and a much heavier story to tell. The challenge was turning all of that into an experience people would actually want to stay with — without softening what the numbers were saying.
- 26,000+
- Nigerians
- 90+
- Data Collectors
- 6
- Geo-political Zones
- 3
- Years
The Challenge
How do you make difficult data engaging without making light of what it says?
PVSR ’25 had more respondents, more historical context and more difficult stories than any edition before it. We were talking about debt, financial anxiety, unstable income, emergency funds and the everyday pressure of making money stretch in Nigeria.
That made the design problem less about displaying data and more about holding attention. The report needed enough clarity to make a huge amount of information understandable, and enough visual expression to keep people moving through it without turning serious findings into entertainment.
The Idea
Treat the data like a story about people, not a report about percentages.
The numbers mattered because there were people inside them. So instead of designing a dashboard or digitising a PDF, we treated PVSR ’25 as an editorial experience with chapters, rhythm, moments of emphasis, human voices and different visual languages for different kinds of data.
You should be able to skim it, study it, stop at a finding that feels uncomfortably familiar, or lose twenty minutes wondering how everybody else is surviving this economy.

Making it readable
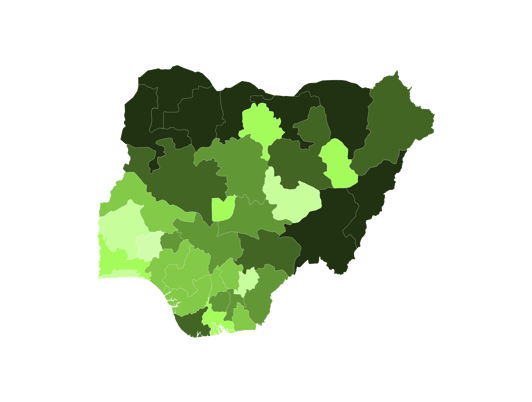
Making 26,000 people readable
Six subjects formed the spine of the report: income, spending, savings, emergency funds, debt and financial satisfaction.
The challenge was giving each chapter a clear rhythm without making every finding feel equally important. Stronger insights got more space, supporting data stayed quieter, and the structure gave people obvious places to pause, skim or keep going.
Making data feel like culture
A financial report shouldn't feel like homework.
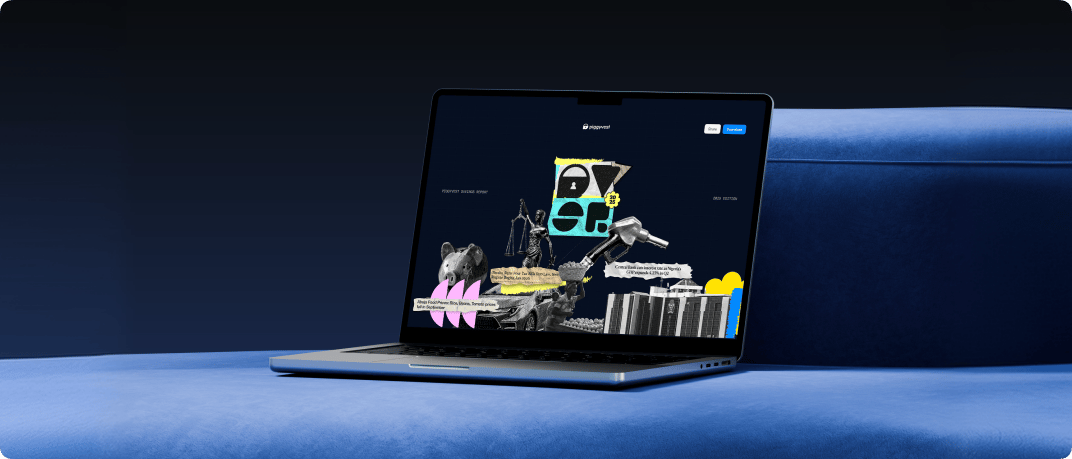
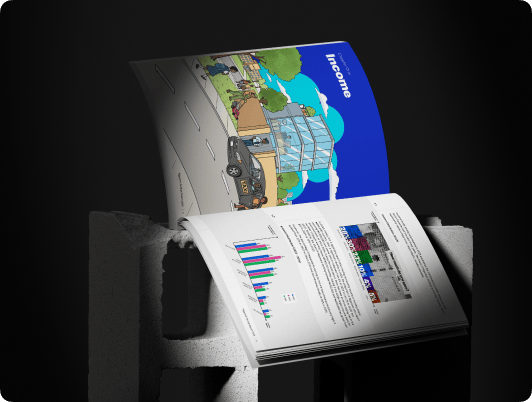
The Savings Report sits somewhere between research, editorial publishing and Nigerian internet culture. PVSR ’25 needed to feel credible enough to carry serious data, but expressive enough that reading it never felt like work.
Collage, bold typography, illustration, photography and an intentionally varied layout gave the report energy between dense stretches of information. The system could be loud when the story allowed it, then get out of the way when the numbers needed to land.
Giving data more ways to speak
A chart is only one way to show a number.
With this much data, defaulting to the same graphs and charts over and over would have made the report feel repetitive very quickly.
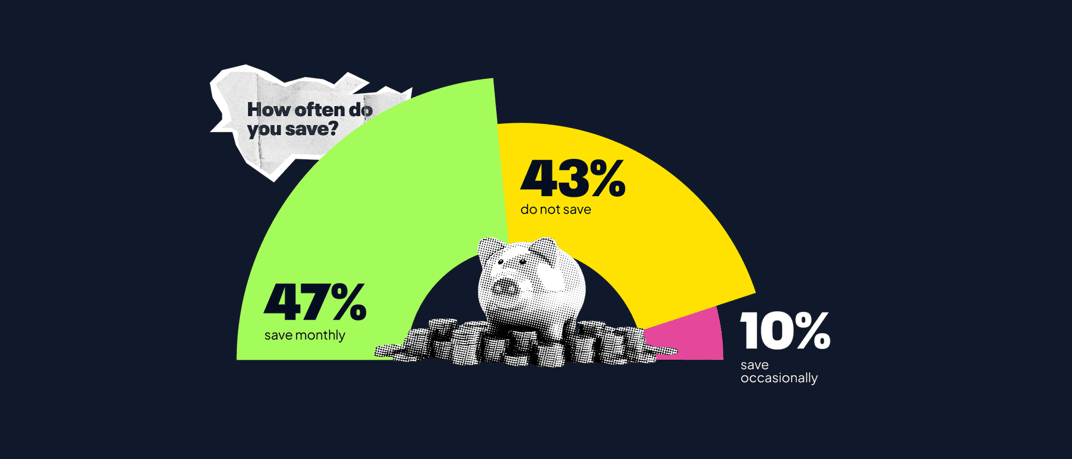
So we treated data visualisation as a broader visual language. Sometimes the clearest answer was a chart. Other times it was scale, typography, repetition, composition, illustration or visual metaphor — choosing the form that best expressed the insight rather than the most familiar way to plot it.
Putting people back in the numbers
Sometimes the best explanation of a statistic is a person saying, “yeah, things are hard.”
Data could tell us that nearly seven in ten Nigerians rely on a single income source. A person could tell us what that actually feels like.
So the experience regularly breaks away from charts and percentages to let respondents and experts speak for themselves. Those pauses stop the report from reducing 26,000 lives to an infographic.

With the current state of this economy, prices are high, and just one source of income is not giving me what I would like.
Outcomes
Three years of making money a conversation.
By its third edition, the Savings Report had grown from an experiment with just over 1,000 respondents into PiggyVest's most comprehensive study of Nigerian financial behaviour yet. The broader Savings Report series has generated 200K+ reads, 40K+ newsletter signups and repeated organic traction on X.
So, how are Nigerians actually doing with money?
Not great, apparently.
But knowing that properly matters. The Savings Report turned thousands of individual experiences into a clearer picture of how people earn, spend, save, borrow and feel about money in Nigeria. My job was to make that picture something people could actually see themselves in.